Stanford Math Tournament 2012
SMT 2012 Archives: Problems and Solutions | Results | Coordinators
Score Distribution Graphs | Item Analysis | Extended Results | Participants
SMT 2012 Archives: Problems and Solutions | Results | Coordinators
Score Distribution Graphs | Item Analysis | Extended Results | Participants
Click the graphs to enlarge.
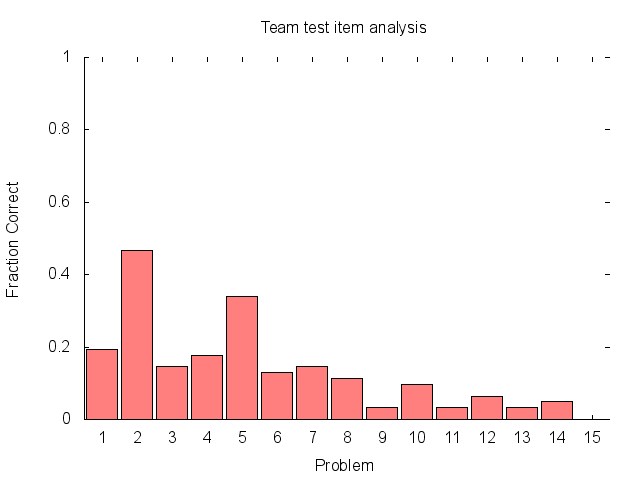
Team test
Total participants: 62
Problem Percent Correct Total
1 19.35 12
2 46.77 29
3 14.52 9
4 17.74 11
5 33.87 21
6 12.90 8
7 14.52 9
8 11.29 7
9 3.23 2
10 9.68 6
11 3.23 2
12 6.45 4
13 3.23 2
14 4.84 3
15 0.00 0
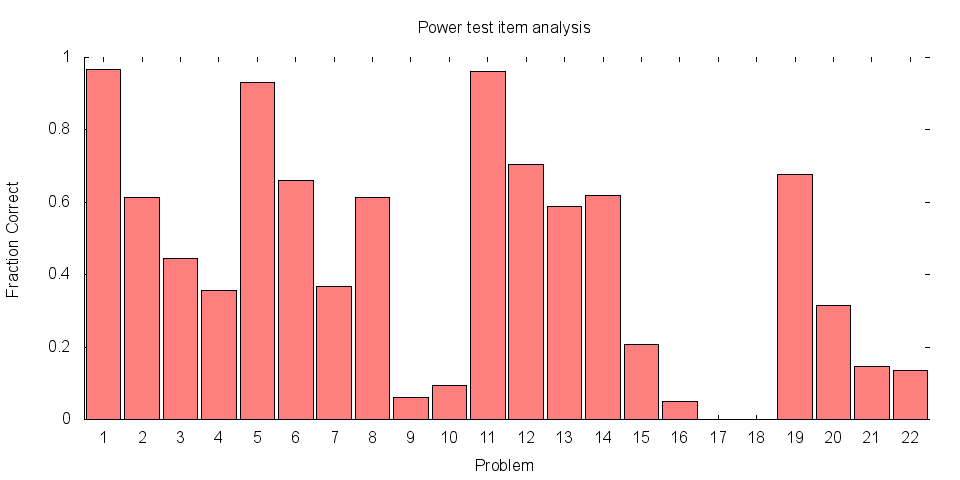
Power test
Total participants: 61
Problem Percent Correct Mean Score Points Total
1 96.72 3.87 4 236
2 61.20 3.67 6 224
3 44.59 2.23 5 136
4 35.74 1.79 5 109
5 93.21 6.52 7 398
6 65.90 3.30 5 201
7 36.68 2.93 8 179
8 61.31 3.07 5 187
9 6.01 0.72 12 44
10 9.43 0.75 8 46
11 96.17 5.77 6 352
12 70.49 4.23 6 258
13 58.74 3.52 6 215
14 61.89 4.95 8 302
15 20.64 3.51 17 214
16 4.99 1.15 23 70
17 0.00 0.00 22 0
18 0.00 0.00 17 0
19 67.76 4.07 6 248
20 31.48 3.15 10 192
21 14.75 0.89 6 54
22 13.52 1.08 8 66
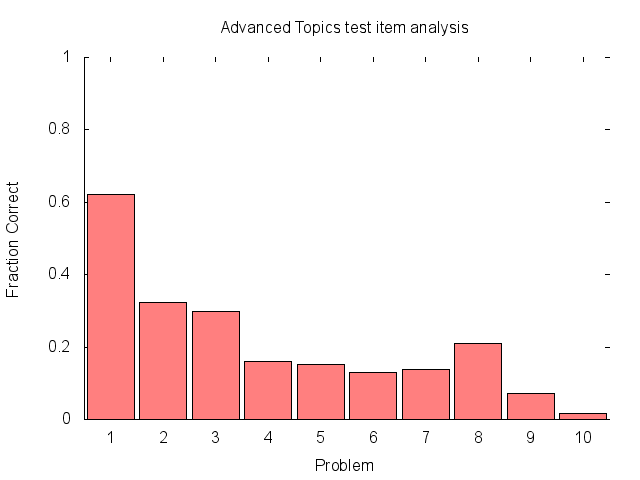
Advanced Topics test
Total participants: 124
Problem Percent Correct Total
1 62.10 77
2 32.26 40
3 29.84 37
4 16.13 20
5 15.32 19
6 12.90 16
7 13.71 17
8 20.97 26
9 7.26 9
10 1.61 2
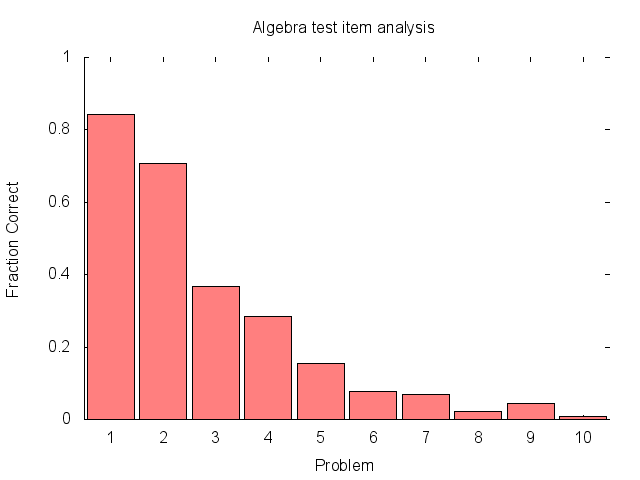
Algebra test
Total participants: 221
Problem Percent Correct Total
1 84.16 186
2 70.59 156
3 36.65 81
4 28.51 63
5 15.38 34
6 7.69 17
7 6.79 15
8 2.26 5
9 4.52 10
10 0.90 2
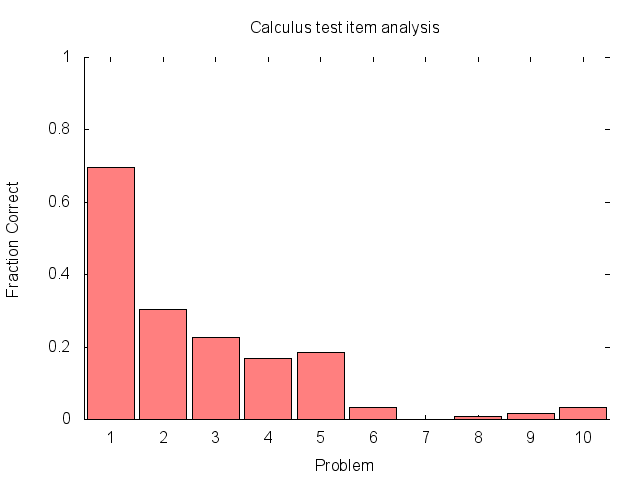
Calculus test
Total participants: 119
Problem Percent Correct Total
1 69.75 83
2 30.25 36
3 22.69 27
4 16.81 20
5 18.49 22
6 3.36 4
7 0.00 0
8 0.84 1
9 1.68 2
10 3.36 4
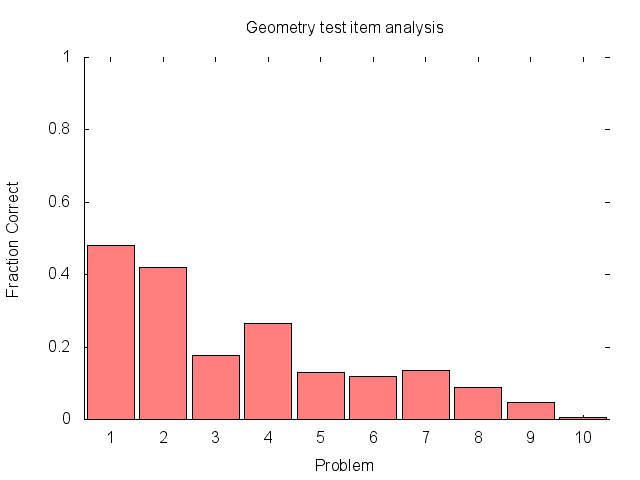
Geometry test
Total participants: 169
Problem Percent Correct Total
1 47.93 81
2 42.01 71
3 17.75 30
4 26.63 45
5 13.02 22
6 11.83 20
7 13.61 23
8 8.88 15
9 4.73 8
10 0.59 1
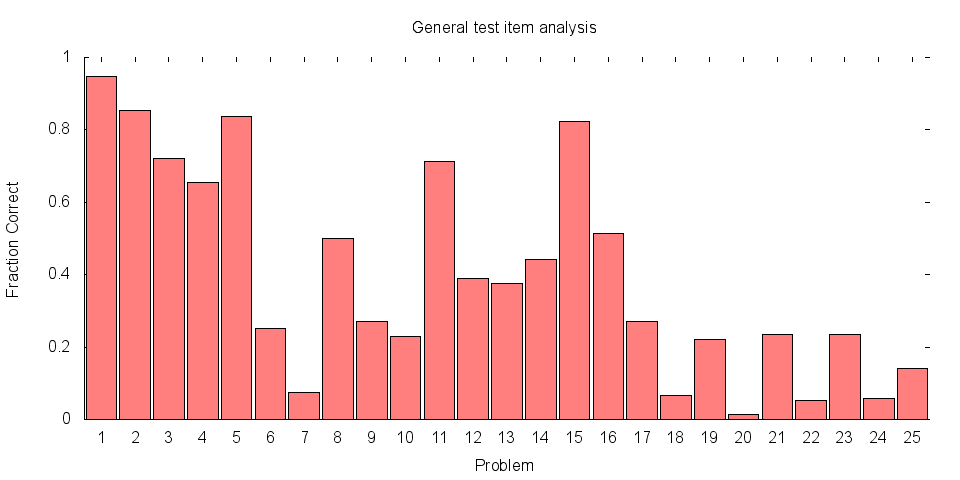
General test
Total participants: 136
Problem Percent Correct Total
1 94.85 129
2 85.29 116
3 72.06 98
4 65.44 89
5 83.82 114
6 25.00 34
7 7.35 10
8 50.00 68
9 27.21 37
10 22.79 31
11 71.32 97
12 38.97 53
13 37.50 51
14 44.12 60
15 82.35 112
16 51.47 70
17 27.21 37
18 6.62 9
19 22.06 30
20 1.47 2
21 23.53 32
22 5.15 7
23 23.53 32
24 5.88 8
25 13.97 19